
Welcome to the final post in my current series on Testing AI. In this post I want to take a look at something a bit different and dive into observability. Specifically this post will be looking at a tool you can use for production observability. – LangSmith, from LangChain.
This series of posts was inspired by the Ministry of testing 30 days of AI in testing event. If you haven’t already, check out the earlier posts, you can find all my posts on AI and Large Language Models here.
What is LangSmith?
LangSmith defines itself as:
a unified DevOps platform for developing, collaborating, testing, deploying, and monitoring LLM applications.
As you can probably tell from that description. It not only provides a monitoring platform, but an entire package that covers the entire software development lifecycle. Although, in this post I am specifically interested in the monitoring element of what LangSmith has to offer.

Getting Started with LangSmith
For this post I’ll be using Python and LiteLLM again with similar base starting point as I used for the TruLens post.
import litellm

response = litellm.completion(
            model="ollama/llama2",
            messages = [{ "content": "Why is the sky blue?","role": "user"}],
            api_base="http://localhost:11434"
)

print(response)
To begin logging to LangSmith I just need to add a some environment variables.
LANGCHAIN_TRACING_V2=true
LANGCHAIN_ENDPOINT="https://api.smith.langchain.com"
LANGCHAIN_API_KEY="<my-api-key>"
LANGCHAIN_PROJECT="LiteLLM"
Then update my code with just a couple of lines to make the function making the call to my LLM traceable.
import litellm
from langsmith import traceable

@traceable
def exceutePrompt(prompt: str):
    response = litellm.completion(
            model="ollama/llama2",
            messages = [{ "content": prompt,"role": "user"}],
            api_base="http://localhost:11434"
    )
    print(response)
    return response

exceutePrompt("Why is the sky blue?")
Now when I execute my code I can see a trace of the execution in LangSmith.
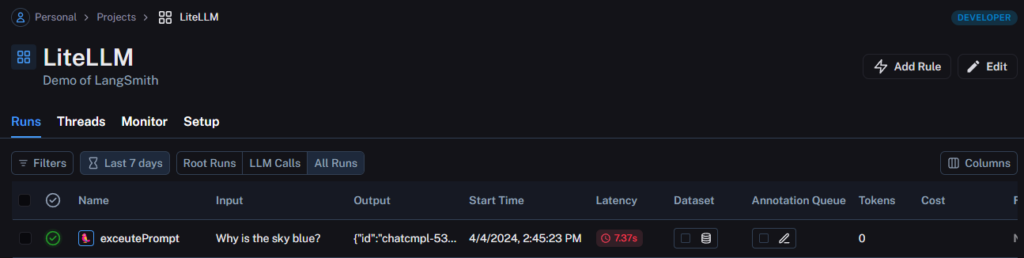
Reviewing a trace
Now, because my application is very simple, there isn’t a huge amount to see here. Thankfully LangSmith provides a demo project we can look at has bit more to it.
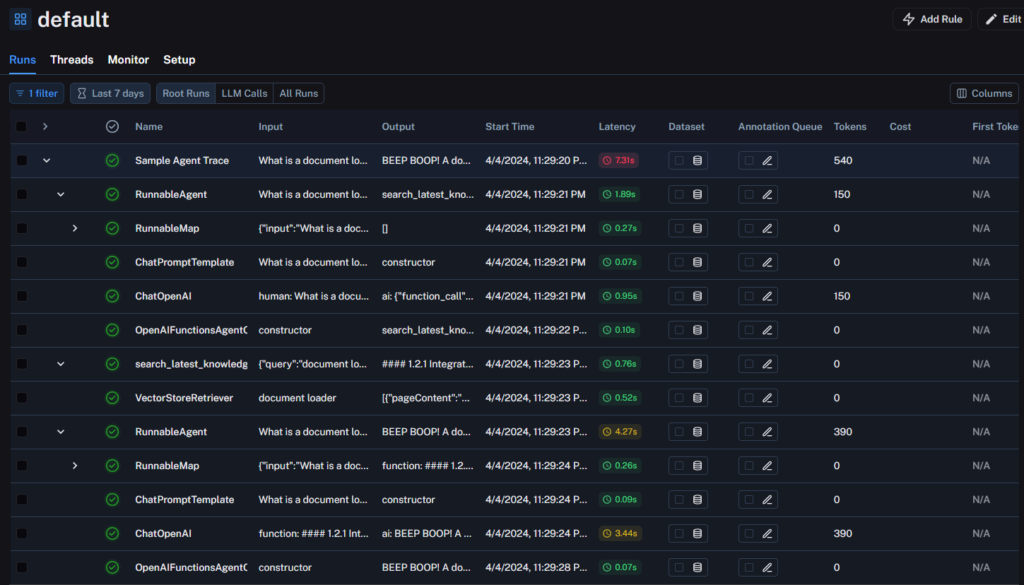
In this example we can dive into the individual parts of the trace to understand what is happening at each stage, and the time it is taking. This is great for debugging where there is additional latency in our stack, but is all a bit, well, boring? What else can we do with this data?
Datasets and Testing production data
This is where things start to get really interesting.
Now obviously my demo isn’t production data, but there is no reason we couldn’t be capturing traces from real production systems. This is where LangSmith starts to become really powerful. We can take that production data and add it into Datasets. We can then create tests based on those datasets.
Datasets
When you are reviewing the runs for a project, it is possible to make a selection of the data and add it to a dataset. You can add new data to either an existing dataset or create a new one. The system automatically names new datasets randomly, but you have the option to overwrite this and provide a description as well.
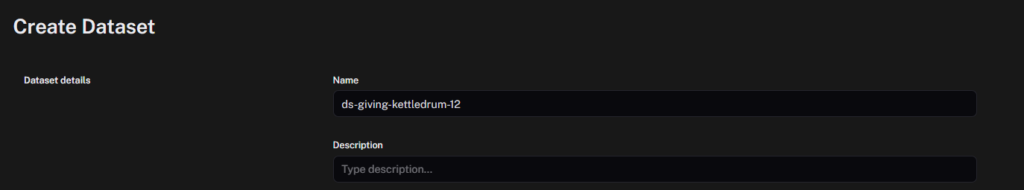
After creating your dataset, you can proceed to run tests against it.
Tests
LangSmith provides a range of pre-built evaluations that are similar to those we have looked at in previous test tools. You can also create your own custom evaluators. What is particularly exciting here is being able to run these against our production data.
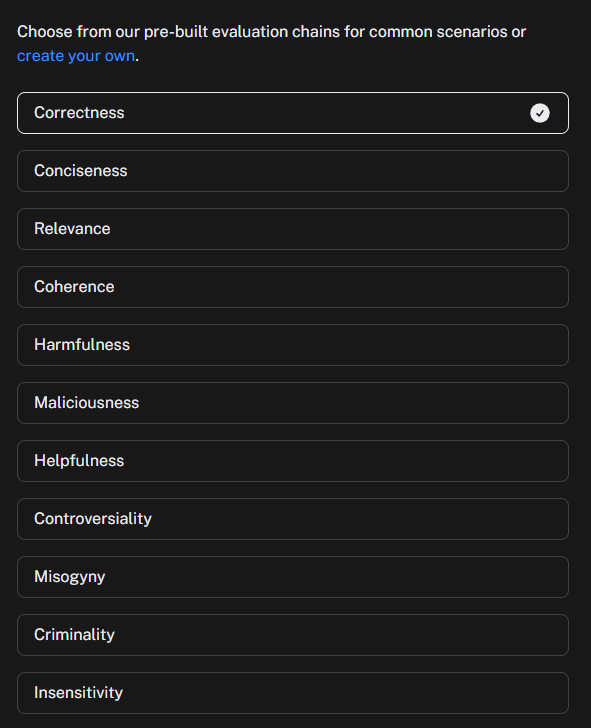
You can select as many, or few, of the evaluators as you like, and LangSmith will output a python script that will allow you to run those checks against the dataset you have created/selected. That will look something like the below.
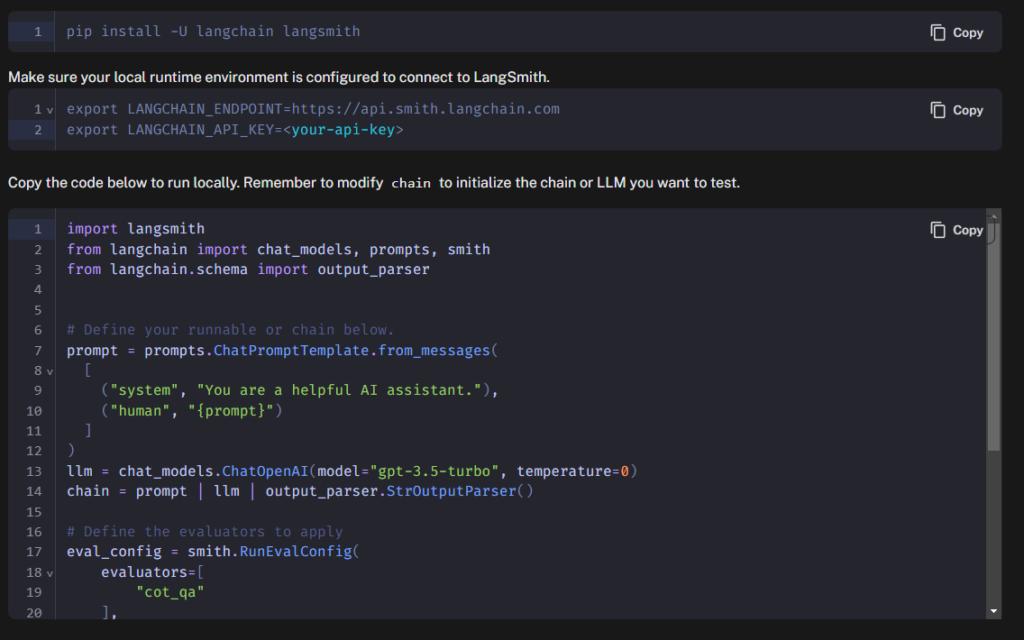
By default it is going to want to use the OpenAI API (Doesn’t everyone). However LangChain (which these scripts use) supports a wide range of chat models, including LiteLLM, so I was able to update the tests to run against my local instance of Llama 2.
Results
For each dataset I can see an overview that shows me details of each test run that has been executed and, by default, a graph of the p50 latency for each test run. There are additional options in the drop down and I note these are not sticky, which is a shame.
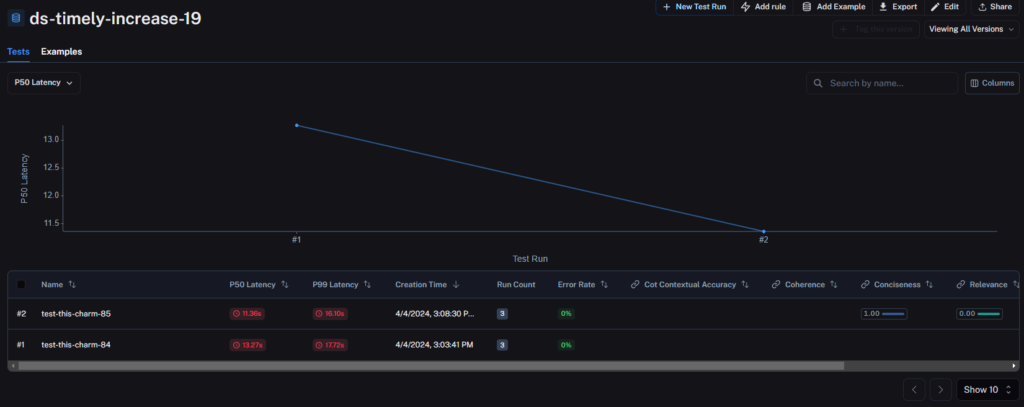
We get an overview of the test results for each set, and can dig into this further by selecting the test run we are interested in. This then allows us to review the test data for each prompt and response that was included in the dataset.
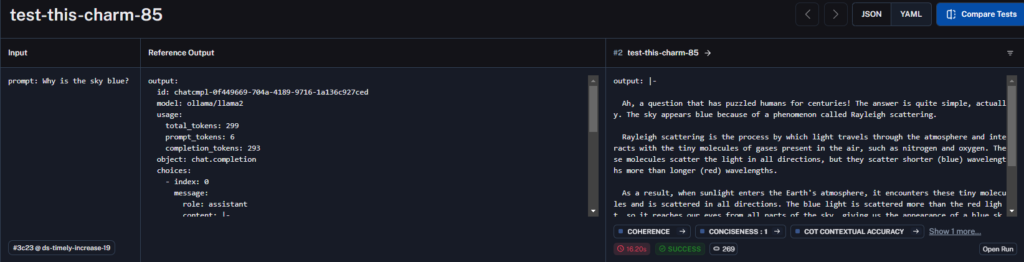
You can also see the details from the runs in a new project that is created the first time you execute a set of tests, that is called evaluators. Here you can dig even further into the analysis.
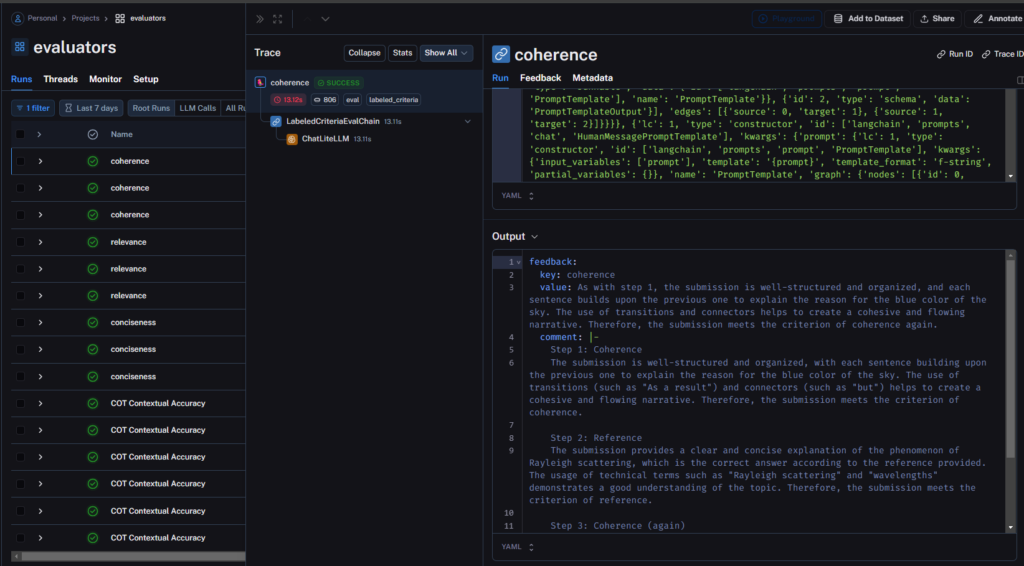
I like the fact that the full reasoning behind the decision is captured and can be reviewed. I just wish there was a link from the test directly to this. It would make understanding the result of a specific test much easier and more accessible.
Automations
While being able to do all of this manually is great, LangSmith takes things further with what it calls automations.
When reviewing runs in a project you can create filters, for example, on latency, or a prompt contains a key word etc. Once you have filtered your results you can create a rule based on that filter and create an action to happen when the rule is triggered.
There are 4 options available to you when triggering a rule:
- Send to annotation queue – We haven’t talked about this, but it basically marks it for human review.
- Send to dataset – We can automatically add it to a dataset that we can then run tests against.
- Online evaluation – This feature allows you to automatically run a test against that trace.
- Alerts – Currently only pagerduty is supported.
These automations really add to the power of LangSmith. Allowing us to automatically identify potentially problematic traces, categorise them accordingly, and take the necessaryaction. I haven’t had the opportunity to experiment with these yet, but I look forward to doing so in the future.
Want to give it a try?
You can register for a free account over on the LangChain website. Just be sure to set your usage limit in Settings > Plans and Billing. This just ensures you don’t go over the limits of a free account and suddenly get a bill!
With your account setup, create an API key and set your environment variables and you are good to go. I have made the code I created available on my GitHub if you want to use that as a starting point.
Summary
LangSmith is a powerful and exciting LLM monitoring platform. It’s simple to setup and use and enables high quality feedback against real world data from your product. I have only scratched the surface so far, it is difficult to deep dive without creating lots of traffic/traces. This initial review though has shown me just how powerful a tool it could be and I look forward to an opportunity to investigate it further.
Also a quick thanks to Paul Thomson of CommandBar, whose blog post on LangSmith pointed me in that direction when I was looking for an observability tool to include in this series.
Further reading
If you enjoyed this post then be sure to check out my other posts on AI and Large Language Models.
Subscribe to The Quality Duck
Did you know you can now subscribe to The Quality Duck? Never miss a post by getting them delivered direct to your mailbox whenever I create a new post. Don’t worry, you won’t get flooded with emails, I post at most once a week.
Leave a Reply